Monday 31 January 2011

Jost Burgi and Logarithms


Just found an article on the net (part of the LOCOMAT project) by Denis Roegel about Jost Burgi's "Progress Tabulen” of 1620. This is the publication that many people use to justify Burgi as an independent inventor of logarithms. In fact, he had made his method known to Tycho Brahe and others prior to the actual publication of Napier's Canon of Logarithms.
Roegel suggest that, in fact, what Burgi has done is :
There is no doubt that Bürgi came very close to the notion of logarithm, but if we
call logarithms a correspondence between two infinite continua representing real numbers, such that multiplication becomes addition, then Bürgi obviously only partly attained it, whereas Napier undoubtedly hit it.47 We can of course understand why this happened. It is in particular clear that Napier’s kinematic approach based on the theory of proportions gave him naturally a firm base in two infinite continua.48 We can also observe that Napier went beyond his needs. He needed only to define logarithms of sines, but his definition goes beyond. Bürgi, on the other hand, basically only needed to define the multiplication of numbers between 1 and 10 (or 108 and 109) and he therefore introduced a restricted way to do these computations, which at the same time prevented him from defining the general logarithm function which he didn’t really need.

A fair comparison between Napier and Bürgi requires a clear definition of the notion of logarithms, but it also makes it necessary to distinguish the abstract notion of logarithm from the knowledge of logarithmic computation. It is by confusing these two notions that many authors were led to attribute the discovery of logarithms to Bürgi or some of his forerunners, when they have in fact only produced what are, admittedly, tables of logarithms.


The date on the article is Jan 11, 2011, only a few days before the date (Jan 31) on which Burgi died in 1632. For those who haven't heard of Burgi, he is considered one of the great mechanics of the period, and created beautiful Armillaries and mechanized globes that are still works of both engineering and artistic beauty. He communicated with Brahe and Kepler, and was urged to publish his "Tablulen" by both.
From Wikipedia:
The most significant artifacts designed and built by Burgi surviving in museums are:

* Several mechanized celestial globes (now in Paris, Zuerich (Schweizerisches Landesmuseum), Stuttgart (Wurttembergisches Landesmuseum) and Kassel (Orangerie,2x,1580-1595) )
* Several clocks in Kassel, Dresden (Mathematisch Physikalischer Salon) and Vienna (Kunsthistorisches Museum)
* Sextants made for Keppler (at the National Technical Museum in Prag)
* The Mond-Anomalien-Uhr (a mechanical model of the irregularities of the motion of the Moon around the Earth)

Roegel doesn't deny the creative greatness of Burgi, but suggest it is greatness of a 2nd order, or as he says in his paper:

That being said, our purpose was in no way to diminish Bürgi’s contributions. Instead, we are a great admirer of his technical and mathematical contributions. But we have felt that justice had not been given to the Progress Tabulen and that wishful thinking by Swiss landsmen had somewhat distorted Bürgi’s work, and that it had again to be put straight.

Although we do not consider that Bürgi discovered or invented logarithms, we think
it is still appropriate to quote the words of Cajori in 1915: “The facts as they are known to-day assign to Napier the glory of a star of the first magnitude as the inventor of logarithms who first gave them to the world, and to Bürgi the glory of a star of lesser magnitude, but shining with an independent light.” [from Florian Cajori. Algebra in Napier’s day and alleged prior inventions of logarithms. In Knott [92], pages 93–109.]

Sunday 30 January 2011

Math Trivia for the Super Bowl

Here is one to bring out and impress your friends during the Super Bowl commercials.....
Ole Romer is mostly remembered (by those who remember at all) for being the guy who first measured the speed of light. He cleverly used Cassini's observation that the moons of Jupiter seemed to have an irregular pattern and decide to measure the eclipse of Io as the earth approached and receded from Jupiter. The difference led him to the first calculation of the speed of light; "light seems to take about ten to eleven minutes [to cross] a distance equal to the half-diameter of the terrestrial orbit".
He was a man of many interests, and among other things was responsible for the first street lights in Copenhagen and the idea of a Meridian Circle. And while working on the design of gears, he came upon the idea of a shape called the Astroid (star like). Because it can be formed by a point moving on a circle rolling around another circle it is also called a hypocycloid. Steeler's fans will recognize it from the helmet decal. If you are old enough, you may remember drawing these with the Spirograph set you got for Christmas.
File:HypotrochoidOn4.gif


The formula for the astroid is x2/3+y2/3=a^2/3. The actual length of the curve is 6a. In a unit circle, this makes the length of the astroid exactly the same as the perimeter of an inscribed hexagon. The area inside the astroid is 3/8 of the circle area.

The astroid is interesting because if you draw any tangent to the curve and extend it so it cuts both the x and y axis, the length of the tangent segments will all be the same.


And perhaps as it should be, there is an asteroid in space, named for Ole Romer who first came up with the astroid shape. And the difference in spelling??? That's just how it's done. Who can explain spelling? It's not like it's math or something that makes sense.

Saturday 29 January 2011

The Mathematics of Karl Marx


This Monday, Jan 31, is the birth date of Sofya Yanovskaya, who was Professor of Mathematics at Moscow State University. She received the prized Order of Lenin in 1951 and in 1959 she became the first chairperson of the newly created department of mathematical logic at Moscow State University. Wikipedia describes her as, "a mathematician and historian, specializing in the history of mathematics, mathematical logic, and philosophy of mathematics. She is best known for her efforts of restoring mathematical logic research in the USSR and publishing and editing mathematical works of Karl Marx." [emphasis added].
Go on, admit it, you didn't know Karl Marx did math did you... yeah, me neither. But it seems his math impacted on the study of math in China much later, and even has an effect on math study there today.

Here is the impact as described by Joseph W. Dauben

Title: Marx, Mao and Mathematics: The Politics of Infinitesimals

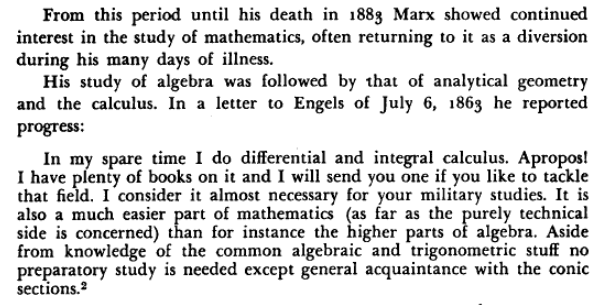
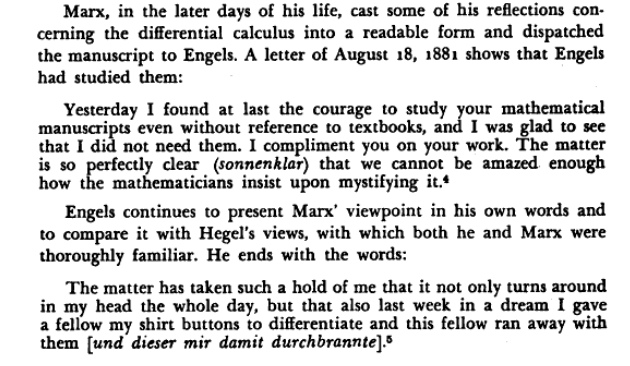
The ``Mathematical Manuscripts'' of Karl Marx were first published (in part) in Russian in 1933, along with an analysis by S.~A. Yanovskaya. Friedrich Engels was the first to call attention to the existence of these manuscripts in the preface to his Anti-D\"uhring [1885]. A more definitive edition of the ``Manuscripts'' was eventually published, under the direction of Yanovskaya, in 1968, and subsequently numerous translations have also appeared. Marx was interested in mathematics primarily because of its relation to his ideas on political economy, but he also saw the idea of variable magnitude as directly related to dialectical processes in nature. He regarded questions about the foundations of the differential calculus as a ``touchstone of the application of the method of materialist dialectics to mathematics.'' Nearly a century later, Chinese mathematicians explicitly linked Marxist ideology and the foundations of mathematics through a new program interpreting calculus in terms of nonstandard analysis. During the Cultural Revolution (1966--1976), mathematics was suspect for being too abstract, aloof from the concerns of the common man and the struggle to meet the basic needs of daily life in a still largely agrarian society. But during the Cultural Revolution, when Chinese mathematicians discovered the mathematical manuscripts of Karl Marx, these seemed to offer fresh grounds for justifying abstract mathematics, especially concern for foundations and critical evaluation of the calculus. At least one study group in the Department of Mathematics at Chekiang Teachers College issued its own account of ``The Brilliant Victory of Dialectics - Notes on Studying Marx's `Mathematical Manuscripts'.'' Inspired by nonstandard analysis, introduced by Abraham Robinson only a few years previously, some Chinese mathematicians adapted the model Marx had laid down a century earlier in analyzing the calculus, and especially the nature of infinitesimals in mathematics, from a Marxist perspective. But they did so with new technical tools available thanks to Robinson but unknown to Marx when he began to study the calculus in the 1860s. As a result, considerable interest in nonstandard analysis has developed subsequently in China, and almost immediately after the Cultural Revolution was officially over in 1976, the first all-China conference on nonstandard analysis was held in Xinxiang, Henan Province, in 1978.


In a JSROR article by Dirk J Struik in 1948 I found this: 


 and this   

Friday 28 January 2011

A Kilogram is a Kilogram is....Oops, Wait...


Just read an interesting article about attempts to standardize the Kilogram in terms of universal constants... that seems not to work..

"Since 1889, shortly after SI units were adopted, the kilogram has been defined as the mass of a cylinder made of platinum and iridium that is locked in a vault at the BIPM."
OK, seems safe enough, but ; "the kilogram's mass relative to several identical copies seems to be decreasing ever so slightly. The shift is troubling because there is no way to tell whether the copies are getting heavier, or the original is getting lighter."

The longstanding plan has been to replace the venerable cylinder with a kilogram defined in terms of a fundamental constant of nature. Fundamental constants are unchanging, [yeah? that's what you said about the mass of a cylinder made of platinum and iridium.] and a definition based on them would make the kilogram as fixed as the laws of the Universe." [which as you are about to discover, may be as flexible as we want them to be]


AHA, but WHICH law... it seems there is trouble in "paradisio scientifica". Two methods are being used; a watt balance which will give a kilogram as a function of Planck's constant, and the other is based on
the number of atoms in a sphere of Silicon, which would give the Kg mass in terms of Avogadro’s number.
BUT... "In recent years, each method has taken measurements accurate to around 30 parts per billion (in relative uncertainty); within reach of the most accurate measurements of the platinum–iridium cylinder. But each experiment's best measurements diverge from each other by around 175 parts per billion, a quantity far larger than metrologists have been prepared to accept."

Ok, that difference won't be noticeable in your next bag of jasmine rice, but this week at the Royal Society in London the former head of the mass division at the International Bureau of Weights and Measures France, suggested that we compromise on the two values, then back calculate to reset Planck's constant and Avogadro’s number...
Surprisingly, not every one liked that idea...

"Let's see, what is Planck's constant on a Tuesday?"

Wednesday 26 January 2011

Understanding Mathematics

Had a talk with a parent the other day that reminded me of this..thought it was worth a repeat run:

I was sitting with a small group of math teachers at a meeting and I asked about their methods of "Testing for Understanding." It seems that for many (most?) the answer was a combination of "They can do the homework." or "They can pass the tests." Am I just looking for too much?

Anyway, while doing some serious research (playing around on Google search) I came across a page called Understanding Mathematics, a study guide by Peter Alfeld.
He writes," You understand a piece of mathematics if you can do all of the following:

Explain mathematical concepts and facts in terms of simpler concepts and facts.

Easily make logical connections between different facts and concepts.

Recognize the connection when you encounter something new (inside or outside of mathematics) that's close to the mathematics you understand.

Identify the principles in the given piece of mathematics that make everything work. (i.e., you can see past the clutter.)

By contrast, understanding mathematics does not mean to memorize Recipes, Formulas, Definitions, or Theorems. "

He then goes on to give a few examples (powers, logarithms, quadratics) which he uses to amplify his explanation.

I think the student who can explain why 8-4/3 = 1/16 without too much armwaving probably has a pretty deep understanding of the exponentiation process.

I'm not as sure about his quadratic solutions model. He talks about the quadratic formula and then states, "Forget about the formula, it's an example of clutter. (To this day I cannot remember it.) But since you understand these matters you know how the formula was derived."

I'm not sure I believe him. Ok, I know that sounds kind of harsh, but if you derive the quadratic formula a few times it sort of sits there looking at you all the way through, doesn't it... I see it and know what it is I'm working toward.

I agree that one ought to be able to derive the quadratic formula by completing the square, or at least solve quadratics without the formula, but then I remember a quote I have from Euler in my notes on "Twenty Ways to Solve a Quadratic Equation": Even a great mathematician like Euler, after deriving the formula, suggests “it will be proper to commit it to memory”. from An Introduction to the Elements of Algebra . Euler understood math, and when crunch time comes, you gotta' really sell me to make me disagree with him.


I don't have a wide range of clear delineators of understanding, but a kid who looks at a quadratic with a positive leading coefficient and a negative constant term and can't tell me how many real solutions it has does NOT understand solving quadratics, no matter what he has memorized. And if I write some ugly equation on the board the kid has never seen before and ask, "What happens to the graph of this if I replace all the x's with x-2 and he says it moves to the right (or left, I'm easy) I think they understand something big. If I tell him that (2,3) and (3,5) are on the graph of f(x) and ask him what f-1(3) is and they have no clue, I think they have missed something big.

Here is a recent example, we were talking about H1N1 and working with the logistic curve and I was explaining that the maximum rate of growth occurred at half the maximum value, such as here.
I suggested that from this point they should be able to see that the ab-t = 1 and that would lead them to see that bt=a. But for many (most) of them sorting out that the exponential part = 1 was too many steps at once... in fact for a large number, it just did not make sense that 1+ab-t=100/50 (seeing past the clutter?). Whether you think of this as a division property or the means and extremes property of proportions, it seems to me that if you don't see this "clumping" (I think that was Polya's term) you can't be very flexible in math patterns.

Ok, so send me your gut tests... If they can do THIS, they mostly "get it", or, conversely, if they can't do THIS, then they definitely don't "get it".

Tuesday 25 January 2011

The First Fractal, The Second Curve

If we assume that the length of a circle's circumference is known (well, do you KNOW pi?), then it was known before 100 BC. So what was the next curve whose length was figured out, and when.. Ok, do that movie thing where you have the pages ripping off the calendar...keep waiting...more pages... lots more... and then in the least expected place.

After centuries of trying to figure out the length of the elliptic circumference, or the length of a parabola... and failing,... mathematicians had about decided that there just were not many curves that could be rectified (find the length).

Then, in 1645, Evangelista Torricelli (he's the guy who invented the barometer) was playing with a logarithmic spiral. Now the logarithmic spiral has several nice properties. First,it is equiangular, that is, if you draw a tangent to the spiral at any point, the angle between that tangent and a line drawn to the origin will always be the same angle. If you write the formula in polar form as
then b is the cotangent of the angle. As b gets close to zero, the angle approaches 90 degrees, and the spiral gets more circular. In fact when b=0, the equation produces a circle.

The log spiral also has the property that if you drew a ray from the origin in any direction, the intersections with the spiral would occur at distances from the origin that are in a geometric ratio; if it crosses at distances of one unit and two units, the next cross would be at four units, and then at eight, etc.


But it was this property that made it such an unlikely candidate to be the 2nd rectified curve because it also decreases toward the origin in proportional steps. So working the same curve I mentioned above back toward the origin it will cross the x-axis at 1/2, and then 1/4, and then...."Holy infinite sequence Batman, this goes on forever." But in spite of the fact that there are an infinite number of spirals around the origin, the distance from any point on the curve to the origin is finite.... read twice, that's right... finite.. and Torricelli not only figured that out, he put a number on it (and the children all say "Ooohhhh.") He did it by recognizing that, although the word would not be invented for over 300 years to come, the log spiral is a fractal. Any part of the curve is self-similar to any other. From this, Torricelli was able to determine that the infinite number of loops around the origin would simply add up to the distance from the tangent to the y-axis. It wasn't quite calculus...but we were sneaking up on it.


The log spiral so enchanted Jacques Bernoulli that he commissioned it to be put on his grave. [unfortunately it wasn't drawn correctly]. His Latin inscription said, "eadem mutata resurgo" which translates to something like "though changed, I will arise the same."

I got an email after I posted this reminding me that Descartes was the discoverer of the equiangular spiral. It seems it comes up when studying dynamics.
I have also been guided to a neat approach to drawing the curve at Wolfram's Mathworld page:


"The logarithmic spiral can be constructed from equally spaced rays by starting at a point along one ray, and drawing the perpendicular to a neighboring ray. As the number of rays approaches infinity, the sequence of segments approaches the smooth logarithmic spiral (Hilton et al. 1997, pp. 2-3). "


Mathworld also has a nice page to illustrate that the log spiral will show up in mutual pursuit problems.
-------------------------
Beautiful story about Toricelli and the barometer, probably false, but still cute: When he was using water filled barometers the tubes would have to be over thirty feet high. Torricelli had one stick through the roof of his house and he put a red floating ball in the water to make it more visible. Unfortunatly, his superstitious neighbors could see this, and became somewhat upset when the appearance and disappearance of the floating "devil" seemed to cause the weather to change... so they stormed his house and burnt it down. That was supposedly ONE Of the reasons he switched to a mercury barometer.

Monday 24 January 2011

Notes on the History of Graph Paper


Just re-ordered graph paper for next year for my department. We don't use nearly as much these days as five or ten years ago... calculators have made them much less common in schools. It reminded me that I hadn't actually put anything here about my notes on the history of graph paper, so for those who are interested...

Graph paper, a math class staple, was developed between 1890 and 1910. During this period the number of high school students in the U.S. quadrupled, and by 1920, according to E.L Thorndike, one of every three teenagers in America “enters High School”, compared to one in ten in 1890. The population of “high school age” people had also grown so that the total number of people entering HS was six times as great as only three decades before. Research mathematicians and educators took an active interest in improving high school education. E. H. Moore, a distinguished mathematician at the University of Chicago, served on mathematics education panels and wrote at length on the advantages of teaching students to graph curves using paper with “squared lines.” When the University of Chicago opened in 1892 E.H. Moore was the acting head of the mathematics department. “Moore was born in Marietta, Ohio, in 1862, and graduated from Woodward High School in Cincinnati. “(from Milestones in (Ohio) Mathematics, by David E. Kullman) Moore was President of the American Mathematical Society in 1902. The Fourth Yearbook of the NCTM, Significant Changes and Trends in the Teaching of Mathematics Throughout the World Since 1910, published in 1929, has on page 159, “The graph, of great and growing importance, began to receive the attention of mathematics teachers during the first decade of the present century (20th)” . Later on page 160 they continue, “The graph appeared somewhat prior to 108, and although used to excess for a time, has held its position about as long and as successfully as any proposed reform. Owing to the prominence of the statistical graph, and the increased interest in educational statistics, graphic work is assured a permanent place in our courses in mathematics.” [emphasis added]
Hall and Stevens “A school Arithmetic”, printed in 1919, has a chapter on graphing on “squared paper”.

Using google's n-gram viewer I arrived at the conclusion that from 1880 until appx 1925 the term square paper was the most popular with coordinate paper close behind.  The earliest mention of graph paper in relation to math education was in Advanced Algebra by Joseph Victor Collins.  I found a use in 1890 of logarithmic graph paper (defined as "Ordinate scales printed on logarithmic graph paper" in a report " Geological Survey Water-supply Paper - Issues 1890-1894").  The term may have been more used in engineering fields before it was adapted in mathematician.  However the shift occurred, by 1830 "Graph paper" was the most common term, and by 1940 it was more common than the other two terms combined, and by 1960 it reached eight times the usage of either of the others.  *PB 

John Bibby has written (August,2012) to advise me that John Perry, who was at the time President of the Institution of Electrical Engineers, has a section on "Use of Squared Paper" in an article in Nature in 1900 (The teaching of mathematics, Nature Aug 1900 pp.317-320.) They wanted $19 to see the article, so I take John at his word. I did find another similar endorsement of "squared paper" by Perry in "Englands Neglect of Science" published in 1900 also. On page 18 after several lamentations about trained engineers who had no ability/understanding of the mathematics applying to their field, he writes: "I tell you, gentlemen, that there is only one remedy for this sort of thing. Just as the antiquated method of studying arithmetic has been given up, so the antiquated method of
studying other parts of mathematics must be given up. The practical engineer needs to use squared paper." 

The actual first commercially published “coordinate paper” is usually attributed to Dr. Buxton of England in 1795 (if you know more about this man, let me know). The earliest record I know of the use of coordinate paper in published research was in 1800. Luke Howard (who is remembered for creating the names of clouds.. cumulus, nimbus, and such) included a graph of barometric variations. [On a periodical variation of the barometer, apparently due to the influence of the sun and moon on the atmosphere. Philosophical Magazine, 7 :355-363. ]
[The above was gathered from a numbur of authoritive sources including a Smithsonian site, but on a recent visit to Monticello, the home of my longtime favorite American Prisident, Thomas Jefferson, I discovered it was in error. I found a use by Jefferson in his use of the paper for architectural drawings earlier than any of these dates. Here is the information from the Moticello web site.]
Prior to 1784, when Jefferson arrived in France, most if not all of his drawings were made in ink. In Paris, Jefferson began to use pencil for drawing, and adopted the use of coordinate, or graph, paper. He treasured the coordinate paper that he brought back to the United States with him and used it sparingly over the course of many years. He gave a few sheets to his good friend David Rittenhouse, the astronomer and inventor:

"I send for your acceptance some sheets of drawing-paper, which being laid off in squares representing feet or what you please, saves the necessity of using the rule and dividers in all rectangular draughts and those whose angles have their sines and cosines in the proportion of any integral numbers. Using a black lead pencil the lines are very visible, and easily effaced with Indian rubber to be used for any other draught." {Jefferson to David Rittenhouse, March 19, 1791}
A few precious sheets of the paper survive today.
The increased use of graphs and graph paper around the turn of the century is supported by a Preface to the “New Edition” of Algebra for Beginners by Hall and Knight. The book, which was reprinted yearly between the original edition and 1904 had no graphs appearing anywhere. When the “New Edition” appeared in 1906 it had an appendix on “Easy Graphs”, and the cover had been changed to include the subhead, “Including Easy Graphs”. The preface includes a strong statement that “the squared paper should be of good quality and accurately ruled to inches and tenths of an inch. Experience shews that anything on a smaller scale (such as ‘millimeter’ paper) is practically worthless in the hands of beginners.” He finishes with the admonition that, “The growing fashion of introducing graphs into all kinds of elementary work, where they are not wanted, and where they serve no purpose – either in illustration of guiding principles or in curtailing calculation – cannot be too strongly deprecated. (H. S. Hall, 1906)” The appendix continued to be the only place where graphs appeared as late as the 1928 edition. The term “graph paper seems not to have caught on quickly. I have a Hall (the same H S Hall as before) and Stevens, A school Arithmetic, printed in 1919 that has a chapter on graphing on “squared paper”. Even later is a 1937 D. C. Heath text, Analytic Geometry by W. A. Wilson and J. A. Tracey, that uses the phrase “coordinate paper” (page 223, topic 153). Even in 1919 Practical mathematics for Home Study by Claude Irwin Palmer introduced a section on “Area Found by the Use of Squared Paper” and then defined “paper accurately ruled into small squares” (pg 183). It may be that the term squared paper hung on much longer in England than in the US. I have a 1961 copy of Public School Arithmetic (“Thirty-sixth impression, First published in 1910) by Baker and Bourne published in London that still uses the term “squared paper” but uses graphs extensively.

Of course "graph paper" could not have preceded the term "graph" for a curve of a function relationship, and many teachers and students might be surprised to know that it was not until 1886 when George Chrystal wrote in his Algebra I, "This curve we may call the graph of the function." The actual first known use of the term "graph" for a mathematical object actually predates this event by only eight years and occurred in a discrete math topic.   J. J. Sylvester published a note in February 1878 using 'graph' to denote a set of points connected by lines to represent chemical connections. In that note "Chemistry and Algebra", Sylvester
wrote: "Every invariant and covariant thus becomes expressible by a graph precisely identical with a Kekulean diagram or chemicograph" .


A more or less famous Kekule structure is the benzine shown at right.

This short note in Nature was more a notice of the more complete paper he had written in American Journal of Mathematics, Pure and Applied, would appeared the same month,  "On an application of the new atomic theory to the graphical representation of the invariants and covariants of binary quantics, — with three appendices,"  The term "graph" first appears in this paper on page 65.  The images he uses appear below. 


Graph has come to have multiple meanings in mathematics, but for most students it relates to the graph of functions on the coordinate axes.  The origin is from the Greek graphon, to write, perhaps with earlier references to carving or scratching. Jeff Miller's web site suggests that the use of graph as a verb may have first been introduced as late as 1898. 
In a post to a history newsgroup, Karen Dee Michalowicz commented on the history of graphing:
It is interesting to note that the coordinate geometry that Descartes introduced in the 1600's did not appear in textbooks in the context of graphing equations until much later.  In fact, I find it appearing in the mid 1800's in my old college texts in analytic geometry.  It isn't until the first decade of the 20th century that graphing appears in standard high school algebra texts. [This matches rise of  graph paper in the same periods].  Graphing is most often found in books by Wentworth.  Even so, the texts written in the 20th century, perhaps until the 1960's, did not all have graphing.  Taking Algebra I in the middle 1950's, I did not learn to graph until I took Algebra II

Math historian Bea Lumpkin has written about the early graphs by the Egyptians in what was an early use of what painters call the grid method:
In my article ... I suggest, "It is possible that the concept of coordinates grew out of the Egyptian use of square grids to copy or enlarge artwork, square by square.  It needs just one short, important step from the use of square grids to the location of points by coordinates.  
In the same posting she comments on the finding of graphs in Egyptian finds dating back to 2700 BC: 
"An architect's diagram of great importance has lately been found by the Department of Antiquities at Saqqara.  It is a limestone flake, apparently complete, measuring about 5 x 7 x 2 inches, inscribed on one face in red ink, and probably belongs to the IIIrd dynasty"  Here is the reason that Clark and Engelbach attached great importance to the diagram.  It shows a curve with vertical line segments labeled with coordinates that give the height of points on the curve that are equally spaced horizontally.  The vertical coordinates are given in cubits, palms and fingers.  The horizontal spacing, the authors write "... most probably that is to be understood as one cubit, an implied unit elsewhere."  To clinch their analysis, Clarke and Engelbach observe:  "This ostrakon was found near the remains of a solid saddle-backed construction, the top of which, as far as could be ascertained from its half-destroyed condition, closely approximated tot he curve obtained from the data on the ostrakon. 


This certainly lays claim to the oldest line graph I have ever heard.  

Sunday 23 January 2011

Math Myths

Just read this on a blog by Dr Michael Taylor..Thought it ought to be printed out and placed on the wall of every math classroom (especially on Parent's night...."Well I'm not suprised he/she is doing poorly... I could never do math." )


Five of the most common math myths are:

1. The Genius Myth (that good mathematicians are born with special math talent and enormous left brains);
2. The Good Memory Myth (that good mathematicians have a phenomenal memory for formulas);
3. The Using-Tools-Is-Cheating Myth (that good mathematicians don’t use fingers, toes and calculators);
4. The Gender Myth (that good mathematicians are all men despite the abundance of female bio-statisticians);
5. The Who Needs it Anyway Myth (that math is useful only to mathematicians).

But the biggest myth of them all is the “I-Cant-Do-Math Myth”. I recently taught multivariate calculus to a class of non-mathematicians and social scientists. It wasn’t just them asking the question “why are we here”? But an open-mind is a powerful adversary. They soon dusted-off this myth in a matter of months. Yes, for some, math is like sorcery. We all have our superstitions to overcome. The good news is that we can. Arthur C Clarke who once said that, “any sufficiently advanced technology is indistinguishable from magic”. If that technology is born of math then however miraculous or foreboding it appears, we will learn to embrace it. Mathematics – to learn. Let’s face our fears, dispel the myths and advance. There are legends to be made.

POSTSCRIPT.....
Steven Colyer suggested two more that could be added to the "Math Myths"

7) Math is boring.

8) Mathematics is finished.

So what else should be on the list.. (and do NOT suggest (x+y)2 = x2 + y2)

Tangible Geometry

Had a comment to a post the other day that turned out to be from a high school senior. I checked out her web site where she does incredibly cool geometric stuff... check it out...
This child obviously does not need homework to get an education.


This one is a stellated icosahedron, and apparently there are 59 different versions of it. [You can download a Wolfram Demonstration of them if you have their free player]
This is the kind of stuff Kepler played with when he wasn't measuring the planets. He discovered two of the three stellations of the dodecahedron (there are three in all).
If you are curious, I will tell you that the tetrahedron and cube have no stellations (figure out why they don't), and the octahedron only has the beautiful stella octangula.

We've Come a Long Way Baby

Steven Colyer had a blog the other day about calculators of his youth. Like me, I think, he grew up with slide rules and hand held calculators were amazing.... and large... and very expensive. He reminded me of a magazine article I had seen, but now can't find, but in searching for it I came across some interesting reminders of how far we have come..
This first is from Popular Science, June 1971, ...just in time for back to school buying.. keep in mind that the conversion would be about $5 in 2011 for every $1 in 1970.

Then there is this picture from the same magazine only four years later..(Feb 1975) The $29 four-function calculators mostly did not have a decimal point.

From the same issue I found this quote reminding us that early calculators were even more damaging to student learning because they didn't use the standard algebraic order of operations; "And it is undeniable that the practice among the £30 to £70 scientific calculators has been to adopt algebraic logic universally — possibly because many potential customers for these machines have graduated from basic four-function ."

It took a while, but eventually there was a graphing calculator. This add is from the New Scientist in September 1987, The prices were as low as 40 GB Pounds, (about $60 then, I think)

Saturday 22 January 2011

Which Platonic Solid is Most-Spherical?


If you inscribe a regular polygon into a given circle, the larger the number of sides, the larger the area of the polygon. I guess I always thought that the same would apply to Platonic solids inscribed in a sphere..... It doesn't. I noticed this as I was looking though "The Penny cyclopædia of the Society for the Diffusion of Useful Knowledge
By Society for the Diffusion of Useful Knowledge" (1841). As I browsed the book, I came across the table below:


The table gives features of the Platonic solids when inscribed in a one-unit sphere. At first I thought they must have made a mistake, but not so. The Dodecahedron fills almost 10% more of a sphere (about 66%) than the icosahedron (about 60%). So the Dodecahedron is closer to the sphere than the others.

Interestingly, if you look at the radii of the inscribing spheres, it is clear that solids which are duals are tangent to the same internal sphere.

But if you look at the table of volumes when the solids are inscribed with a sphere inside tangent to each face:

When you put the Platonic solids around a sphere, the one smallest, and thus closest to the sphere is the icosahedron.

This leads to the paradox that when platonic solids are inscribed with a sphere, the icosahedron is closest to the circle in volume (thus most spherical?) but when they are circumscribed by a sphere, the dodecahedron is the closest to the volume of a sphere (and thus most spherical?)... hmmm

Here is a table of the same values when the surface area (superficies) is one square unit. Notice that for a given surface area, the icosahedron has the largest volume, so it is the most efficient "packaging" of the solids (thus more spherical?).
I guess that makes it 2-1 for the icosahedron, so I wasn't completely wrong all along.

POSTSCRIPT:::  Allen Knutson's comments on the likely cause of this reversal of "closeness" to the sphere:

I think it's about points of contact. On the inside, the dodecahedron touches the sphere at the most points (20), and on the outside, the icosahedron touches the sphere at the most points (again 20).
Indeed: my recipe would suggest that inside, the 8-vertex cube is bigger than the 6-vertex octahedron, and outside, the 8-face octahedron is smaller than the 6-face cube. Both are borne out by your tables. Thank you, Allen

To Learn, Take a Test


Heard about this report on several blogs, Gas station without pumps and a Quantum Blog in particular

Here is a cut from Quantum Blog:

The article, To Really Learn, Quit Studying and Take a Test Already, reports on new research findings reported in Science that students who take a test asking them to actively recall information retain more than those who simply “study” or make concept maps. But what is awesome about this study is they didn’t just measure how the students performed using the various study strategies, it also measured how the students thought they performed.
Here is the money quote from the NYT:
These other methods [rereading notes and concept mapping] not only are popular, the researchers reported; they also seem to give students the illusion that they know material better than they do.
In the experiments, the students were asked to predict how much they would remember a week after using one of the methods to learn the material. Those who took the test after reading the passage predicted they would remember less than the other students predicted — but the results were just the opposite.

I have worked for the last few years to learn to sit quietly in staff development days when they present each new "best practice".  Now I can set quietly and SMILE... Ain't research grand.

The actual article is here in Science, but they charge mega-bucks to download... go to the library instead. 

SO... my newest new years resolution.... give a test in every class every week..

Friday 21 January 2011

A Neat Solution to the Towers of Hanoi Problem


Just browsing through Wikipedia, and they show a solution to the Towers of Hanoi puzzle that I had never seen using a ruler as a solution key.

If you have been off planet for the last 130 years and don't know the Towers problem, you can play online here. You might try that first, and set the number of discs to 6 so that it matches the solution shown below.

And for those who know the game but just want to see how a ruler is used, here is the graphic.


For any move, just move the disc whose size compares to the marks on the ruler. For instance the first five marks on a ruler marked in 32nds would be 1/32, 1/16/ 3/32, 1/8, 5/32.... The denominators tell you which disk to move. The largest denominator (smallest scale) goes with the smallest disc, etc. If you then apply two fundamentals of any solution, always move the smallest disc From rod A, to B to C and back to A in a cycle, and never put a bigger disc on a smaller one, then you have a solution... That's easier than Gray codes isn't it.

Why have I never encountered this before? The connection was made in 1956 by Donald W. Crow, in relation to traversing the vertices of a cube in n-dimensions[ D. W. Crowe, The n-dimensional cube and the tower of Hanoi, Amer. Math. Monthly, 63 (1956), 29-30.]

Those interested in a little history of the Puzzle can find a few brief notes here.

POSTSCRIPT:::: For another really insightful solution (maybe the best of them all) See the comment by Jeffo....Thanks guy, why don't I see ideas like that?

Thursday 20 January 2011

Microsoft Mathematics is FREE!


Am I the last person on the block to come across Microsoft Mathematics? I downloaded it (which is now free, it seems) and tried it out this week.

Here is a brief description from the "About" notes:

Microsoft Mathematics provides a set of mathematical tools that help students get school work done quickly and easily. With Microsoft Mathematics, students can learn to solve equations step-by-step, while gaining a better understanding of fundamental concepts in pre-algebra, algebra, trigonometry, physics, chemistry, and calculus.

Microsoft Mathematics includes a full-featured graphing calculator that’s designed to work just like a handheld calculator. Additional math tools help you evaluate triangles, convert from one system of units to another, and solve systems of equations.

It seems to have several nice features that kids at the 9-12 level would enjoy. I noticed right off that some of my kids studying trig would love the fact that it has an inverse function for the secant, cosecant, and cotangent that works in degrees, radians and the almost extinct, gradians (more commonly called grads). If you don't know what grads are read here.


It also has several computer algebra skills, indefinite integrals, expansion of powers of an expression (for students, it will raise (x+y)^5 and expand it), and of course factoring. It works in real and complex numbers, graphs in 2d and 3d with input in Cartesian, of polar form (and you can enter implicit relations..
The matrix input allows up to 15x15, and the linear algebra keys include dot(inner) and cross products and will row reduce a matrix (yes it does inverses, but you don't HAVE to use it).

It will solve equations or do integrals and then show and explain the steps.


I expect that many students will abuse this as they do other technologies available to them, but the student who really wants to learn math can use this as a valuable resource.

There is also an add-in for Word.

A Little Math Music Maestro

I recently wrote about the historical connection between math and poetry and now we have to think about the connection between music and math. Anyway, thanks to Dave Richeson who had this and several other "math songs" on his Division By Zero blog recently. My students may all be too young to remember Queen..

but Enjoy anyway.


And of course, a tired old joke I tell my students each year as we get to integration:
Two math professors are sitting in a pub.
"Isn't it disgusting", the first one complains, "how little the general public knows about mathematics?"
"Well", his colleague replies, "you're perhaps a bit too pessimistic."
"I don't think so", the first one replies. "And anyhow, I have to go to the washroom now."
He goes off, and the other professor decides to use this opportunity to play a prank on his colleague. He makes a sign to the pretty, blonde waitress to come over.
"When my friend comes back, I'll wave you over to our table, and I'll ask you a question. I would like you to answer: x to the third over three. Can you do that?"
"Sure." The girl giggles and repeats several times: "x to the third over three, x to the third over three, x to the third over three..."
When the first professor comes back from the washroom, his colleague says: "I still think, you're way too pessimistic. I'm sure the waitress knows a lot more about mathematics than you imagine."
He makes her come over and asks her: "Can you tell us what the integral of x squared is?"
She replies: "x to the third over three."
The other professor's mouth drops wide open, and his colleague grins smugly when the waitress adds: "...plus C."

Wednesday 19 January 2011

More About Distribution of Births

In a comment on my blog about the Distribution of Birth Dates, Mary O'Keeffe sent a link to an article that addressed several questions about the distribution of births, including how tax incentives had changed births around the end of the year.

"Here is an abstract from a paper published in the Journal of Political Economy which attempted to measure the size of the tax incentive effect on behavior.

Because the tax savings of having a child are realized only if the birth takes place before midnight, January 1, the incentives for the "marginal" birth are substantial. Using a sample of children from the National Longitudinal Survey of Youth, we find that the probability that a child is born in the last week of December, rather than the first week of January, is positively correlated with tax benefits. We estimate that increasing the tax benefit of having a child by $500 raises the probability of having the child in the last week of December by 26.9 percent."

The article had several nice graphs and tables. Here are a couple of graphs that I found pertinent:

This chart shows the births in the last week before new years (Black) and the following first week in January for consecutive year. You can click on the chart to enlarge.

It also had a graph which supported my belief that weekend births had become far less likely with the practice of inducing labor. Here is that one:

"Complex" Physics?


I love the new one from XKCD... Here is only the teaser frame.. go there.

Tuesday 18 January 2011

Distribution of Birth Dates


I recently wrote about several variations of the Birthday problem, here and here. Steven Colyer from "Multiplication by Infinity" Blog pointed out in a comment that in reality the distribution of birthdays is not uniform. There are months and days that are more likely than others.

I actually have a graph that I show my Stats kids each year that illustrates this. In this age of births in hospitals the number of births on holidays and weekends is reduced. My only file on this is from 1979, and I suspect the difference is even more exaggerated in more recent years.

In this graph the day of the year (1-365) is on the x-axis and the number of babies born is on y.


You can see the Sat/Sun values are about 80% of the weekdays. You can also see a rise in births in the late summer, about July to September.
Ok, if you want this one, you can find it at the chance data base which you can cut and paste to almost any statistical software.

If anyone has a more current birth by date data chart for a single year I would love to have it.

Roy Murphy (murphy@panix.com) retrieved birthdates from 480,040 insurance policy applications made between 1981 through 1994 of a Life Insurance Company.
Here is the distribution by month compared to the expected number:


Also, for those who are sure to ask...
A scientific study conducted in 1994 found that "scientific analysis of
data does not support the belief that the number of births increases
as the full moon approaches, therefore it is a myth not reality."
See:
"Labor ward workload waxes and wanes with the lunar cycle, myth or reality?"
source: PUBMED, National Libary of Medicine, hosted by nih.gov

Monday 17 January 2011

Tortured by Math- Dangerous Knowledge

I was exposed to a nice collection of You Tube videos that cover the BBC Documentary Dangerous Knowledge from 2007 on the Math Frolic blog by Shecky

"In this one-off documentary, David Malone looks at four brilliant mathematicians - Georg Cantor, Ludwig Boltzmann, Kurt Gödel and Alan Turing ..."

Here is the first of ten.


You can find the entire set.

Sum of Cubes, Square of sum..Potato/Po'ta toe?

Ok, here is an interesting trick; take any number and make a list of its factors (including one and itself). Now count the number of divisors each factor has (include one and the number itself) and put them in another list. Now cube each of the numbers in that new list, and also square the sum of the list. MAGIC???

Let me illustrate. If I pick 12 the factors are {1, 2, 3, 4, 6 and 12}. The number of factors of those numbers are {1, 2, 2, 3, 4, 6}. The magic part... 13+23+23+33+43+63=324... and (1+2+2+3+4+6)2= (18)2= 324...

This is related to the well known relation that for any string of consecutive integers {1,2,3, ...n} the sum of the cubes is equal to the square of the sum. (student's should prove this by induction).

I came across this recently at a blog called Alasdair's Musing. He gives credit to Joseph Liouville. He has a nice proof of the relation using Cartesian cross products of sets. Yes, children, you want to know what that means.

Saturday 15 January 2011

Unbelievably Prime-emirP ylbaveilebnU

Where do they find the time? I came across this amazing piece of trivia on a web page called "Futility Closet" by Greg Ross.

3139971973786634711391448651577269485891759419122938744591877656925789747974914319
422889611373939731 is prime, whether it’s spelled forward or backward. Further, if it’s cut into 10 pieces:


through and through - reversible primes

… each row, column, and diagonal is itself a reversible prime.

Discovered by Jens Kruse Andersen.

Now I'm wondering, is it possible to find a four digit prime that might be similarly divided into a 2x2 rectangle with the same row, column and diagonal primeness? Ahh go on, you know you want to.... but share if you find one.

OK, so 13 and 31 are reversible primes, and 1331 is ....crap.. ok your turn.

Math and Poetry

My beautiful wife Jeannie is a poet, so I like the idea that the connections between math and poetry goes back a long way. It might surprise you to know that :
1) The first use of binary numbers
2) The first recorded illustration of what we now call Pascal's Arithmetic Triangle
3) The Fibonacci sequence
All appeared first in a book on Sanskrit poetry around 2000 BC, Pingala's "Chandahsutra".

Poetry in Sanskrit, and it seems in some modern languages, poems are described by the pattern of long and short syllables. Very little is known about the author's life, and in fact it seems that anything that is stated in one ancient text is contradicted by another.
What we know about the work comes from an upgrade of the text created by a 10th century mathematician named Halayudha.

Describing short and long syllables seems a natural stimulus for binary notation. Instead of zero's and ones, Pingala used (or we suspect that he used) symbols for syllables which were Guru (heavy-given two beats) or Laghu (light-given one beat).

To illustrate that there could only be eight line patterns with three syllables he lists them: LLL, LLH, LHL, HLL, LHH, HLH, HHL, HHH.

I think there is still some doubt about whether Pingala actually made a diagram similar to the arithemtic triangle (which they called meruprastāra) or if that was added by Halayudha. In any event, it seems quite easy to see that for n= 2,3,4 etc syllables, and count the number of short syllables we get

1 1 short or long
1 2 1 short short, short long, long short, long long
1 3 3 1

and the triangle is born.

But if you decided to count the number of lines by length (remember heavy syllables last twice as long as light ones)..

There can only be one line of length one, it has a single light accent.
There is also only one line of length two, a single heavy accent.
But for length three you can get two different types, HL, LH, or LLL
And by now you expect that somehow there will be five patterns for length four. Sure enough LLLL, LLH, LHL, HLL, HH.... and we have the Fibonacci sequence.

It is easy to see that the number of patterns of length N, would be all the patterns of length n-2 followed by a heavy accent, plus all the patterns of length n-1 followed by a light accent. This is just the recursive definition of a Fibonacci sequence.

And in honor of the Woman I love, and the 4000 year association between the things we love, here is a poem she wrote years ago in Japan. It was inspired by a friend, Idell Tong, who was in charge of something planned around the school. When Jeannie asked her how it was going, she replied, "Well, you know my philosophy, If you have a spare minute, worry." That became this:


TIME WELL SPENT
The Walls of your world are crumbling.
Your wrinkled brow is beaded with sweat,
All the plans you made are disintegrating,
Got a minute? FRET!

When the boss's deadline is looming,
You know your rat is losing the race,
And your best is just not good enough.
Now's the time to PACE!

You're stuck in rush hour traffic,
Urging the taxi driver to hurry,
He gives you the glance of annoyance.
Just sit back, scowl, and WORRY!

The BIG event is scheduled,
Here you are with nothing to do,
All the presentations are perfect.
Don't rest on your laurels....STEW.

Friday 14 January 2011

"You Ain't Seen Nothing Yet", But You Might Soon

Apologies to Bachman Turner Overdrive...
In my recent blog about the solution to a variation of the birthday problem I promised to expand on the idea that if you haven't witnessed an occurrence of an event in a large (large enough) number of multiple trials, then we can say with confidence (95% statistically) that the probability of success will be no greater than 3/n. This is often called the "statistical rule of three."

If a binomial event has a probability of p, then the probability that after n trials there are no successes will be (1-p)n, you have to have a non-success every trial. And if you want that probability to be less than .05, then we have an exponential equation to solve, We take the natural log of both sides to make the problem simpler to solve,
Now if you have been wondering about where the three gets into it, this is it... the ln of .05 is very nearly -3. This gives us . Now we have to do a little calculus approximation. For very small values of p, ln(1-p) is very close to -p. Which means our equation is almost ..and dividing we can arrive at p=3/n.
So if we collect give 30 people an injection and none of them can experience a side effect, the rule of three suggests that we can be pretty (95%) sure that the true probability of the side effect is no greater than 1/10.

It seems to me that this approach is looking at the problem a little wrong. Let me try to explain. Let's take a very simple problem. Suppose we have a machine that spits out two ping-pong balls every time you press a button. The machine has five settings inside that control the probability that the ping-pong balls are white (otherwise they are some other color). The probabilities are equally spaced, 0, 1/4, 1/2, 3/4, and 1.
We want to know how how frequently we might get no white balls when we push the button. We make a table of the possible settings, and the probability that both balls are non-white.


Since the machine settings are random each of them has a probability of 1/5. To find the total probability of getting no whites, we multiply 1/5 times each probability and add them up. (1/5)(1)+(1/5)(9/16)+(1/5)(1/4)+(1/5)(1/16)+(1/5)(0)= 3/8. We would expect that, on average, 3/8 of the times we run the machine, we get two non-white balls.

But there is a different question that can be asked: "if someone got two non-white balls, what is the probability that the machine was set at some particular value (say p=1/2). This is the "conditional probability" that seems to make students crazy. But in this situation it look pretty clear. Of 80 people who ran the machine, 30 of them got two non-white balls. If we look just at this 30 people, we would see that only 1 of them had occurred when the machine was set to p=3/4, 4 when it was set to p=1/2, and the other 25 occurred when the machine was set to p=1/4 or p=0.

Notice that we can say two very similar sounding things that are quite different.
1) The probability you get two non-white balls IF the machine probability of white is set to p=1/2 or greater is less than 1/4. (I think this is the approach the rule of three uses)
2) The probability the machine is set to p(white)=1/2 or higher IF you get two white balls is 5/30 or 1/6. (I think this is the way the confidence interval should be calculated.)

Now if we extend the number of options of the machine probability of white to any real number in the interval 0 to 1, then we can answer the same questions using integration to find the area under the curve (1-p)2 to give us the probability of getting two non-white balls. It turns out to be 1/3.

Now we can answer the same two questions as above
1) The probability you get two non-white balls IF the machine probability of white is set to p=1/2 or greater is less than 1/4. (This is exactly the same as before, we are just asking what is the function value when the input is 1/2)
2) The probability the machine is set to p(white)=1/2 or higher IF you get two white balls is the ratio of the shaded area to the right of x=1/2 to the total shaded area. It turns out that in this case (two failures) we get about .043/(1/3) or about 12%.

So what if we got three or four or more failures. The graph starts to look more and more skewed as the probability of failure clumps to the left of the curve. Here is the graph of (1-p)5 in red, and(1-p)10 in blue .


Our rule of three says that if we got ten consecutive failures, we can be pretty sure that the prob of success is probability greater than 3/10. I turns out that for p=3/10, the probability of getting ten failures in a row is about 2.8%, and even lower for any probability greater than 3/10. This suggests that even for relatively small values of n, the limit of 3/n is a conservative approach to bounding the probability of an occurrence. But is it the best estimate of the probability given that we have ten failures. Given that we have had ten failures, the probability that the success probability was 3/10 or higher is the ratio of the area under (1-p)10 between 3/10 and 1 (about .00179) over the area between 0 and 1 (that's 1/11 or .0909090..). The overall ratio is a little less than 2%.

The conclusion for me? The rule of three is a very over-cautious estimate, but well worth the effort when you consider the ease of computation.

Who Created the Birthday Problem, and Even One More Version

Steven Coyler who blogs at Multiplication by Infinity sent me a nice comment on my last blog that included a time line of big moments in the development of the birthday problem. It was, I believe, part of a larger work that he blogged here on conjoining the time lines from the book "50 Things You Really Should Know About Mathematics."


The last part of his time line on the birthday problem said, "1939 - Richard von Mises proposes the birthday problem." You can search almost anywhere and find that confirmed...but being the contrary guy I am, I will disagree. I realize that in disagreeing with Crilly I am disagreeing with an established world class Math Historian (his biography of Arthur Cayley is classic work)..... and yet I press on.

I think it may be that
A)the birthday problem as we know it was not first given by von Mises and
B) the typical version may have appeared over twelve years before von Mises publication.....(but von Mises may have published first).

For support I call upon that great historian of mathematical recreations, David Singmaster. In his "Chronology of Recreational Mathematics" he has:

1927 Davenport invents Birthday Problem.


|
|
|
1939 von Mises first studies Birthday Problems, but not the usual version.
1939 Ball-Coxeter: Mathematical Recreations and Essays, 11th ed. - first publication of Davenport's version of the Birthday Problem

In another note he gives source information:
Richard von Mises. Ueber Aufteilungs und Besetzungs Wahrscheinlichkeiten. Rev. Fac. Sci. Univ. Istanbul (NS) 4 (1938 39) 145 163. = Selected Papers of Richard von Mises; Amer. Math. Soc., 1964, vol. 2, pp. 313 334. Says the question arose when a group of 60 persons found three had the same birthday. He obtains expected number of repetitions as a function of the number of people. He finds the expected number of pairs with the same birthday is about 1 when the group has 29 people, while the expected number of triples with the same birthday is about 1 when there are 103 people. He doesn't solve the usual problem, contrary to Feller's 1957 citation of this paper.


and another:
Ball. MRE, 11th ed., 1939, p. 45. Says problem is due to H. Davenport. Says "more than 23" and this is repeated in the 12th and 13th editions.


Regarding Davenport, he has :
George Tyson was a retired mathematics teacher when he enrolled in the MSc course in mathematical education at South Bank in about 1980 and I taught him. He once remarked that he had known Davenport and Mordell, so I asked him about these people and mentioned the attribution of the Birthday Problem to Davenport. He told me that he had been shown it by Davenport. I later asked him to write this down.
George Tyson. Letter of 27 Sep 1983 to me. "This was communicated to me personally by Davenport about 1927, when he was an undergraduate at Manchester. He did not claim originality, but I assumed it. Knowing the man, I should think otherwise he would have mentioned his source, .... Almost certainly he communicated it to Coxeter, with whom he became friendly a few years later, in the same way." He then says the result is in Davenport's The Higher Arithmetic of 1952. When I talked with Tyson about this, he said Davenport seemed pleased with the result, in such a way that Tyson felt sure it was Davenport's own idea. However, I could not find it in The Higher Arithmetic and asked Tyson about this, but I have no record of his response.
Anne Davenport. Letter of 23 Feb 1984 to me in response to my writing her about Tyson's report. "I once asked my husband about this. The impression that both my son and I had was that my husband did not claim to have been the 'discoverer' of it because he could not believe that it had not been stated earlier. But that he had never seen it formulated."
I have discussed this with Coxeter (who edited the 1939 edition of Ball in which the problem was first published) and C. A. Rogers (who was a student of Davenport's and wrote his obituary for the Royal Society), and neither of them believe that Davenport invented the problem. I don't seem to have any correspondence with Coxeter or Rogers with their opinions and I think I had them verbally.


So my spin on all this is that probably Harold Davenport came up with the version, "How many people are needed for the probability of a match to be greater than 1/2?", but did not publish it anywhere. This is not uncommon in recreational problems. Consider the Collatz problem which seemed to circulate around and across college campuses for years with multiple names. In or around 1939 von Mises was at a party and came up with a slightly different version, "How many pairs of birthday matches would you expect for a collection of n people?" This is the inverse relationship to the common birthday problem today which asked, given an expected value of 1/2, what is the probability of a match.

I also found an interesting variation of the problem that should be of interest to Steven Coyler. The book he quoted in the comment post is authored by Tony Crilly from Manchester here in the UK. As I was checking some notes in Dr. Singmaster's sources, I came across this citation:
Tony Crilly & Shekhar Nandy. The birthday problem for boys and girls. MG 71 (No. 455) (Mar 1987) 19 22. In a group of 16 boys and 16 girls, there is a probability greater than ½ of a boy and a girl having the same birthday and 16 is the minimal number.

Folks who like probability might try to derive that result.

The problem, I am told, is in this book


Addendum:
A few years after I wrote this, I came across yet another version of the birthday problem I had never considered.
How many people needed so probability is 50% that everyone shares a birthday with at least one other?
The strong birthday problem has applications to the interesting problem of look-alikes, which is of interest to criminologists and sociologists.

The answer, it seems, is 3,064.
Amazingly, with 2000 people in the room, the probability is only 1/10000, but by the time you get 4000 the probability is .9334. In even a pretty small village, there is a pretty good chance that someone else shares your birth date.