In a recent post I commented on the "discovery" by a British High School student,Anthony Bayes, of a graphic relationship that allowed every point on the coordinate plane to represent a quadratic equation of the form x2+bx+c=0.
I was impressed that a high school age student would come up with the idea of a transformation from a quadratic to a point on the plane. THEN.... a few days ago I came across a post from the Mathematical Gazette, January of 1913, entitled "A Graphic Solution of the Equation xn-px+q=0, much of which dealt with the idea that the curve 4y=x2 (which the author called the Discriminant Curve) would serve as a graphic solution approach for any quadratic of the form x2-px+q=0.
Note the use of -p, a step up from what young Anthony had used, making it a slightly more useful approach, and perhaps testifying to the independence of his discovery. The author of the piece, A. Lodge, (with no other information given), did not claim it as original, nor site another use.
So the solutions to the equation x2-px+q=0 are found by the points where the tangents to 4y=x2 intersect the x-axis.
The article also pointed out, and I admit I had never thought of this, that the solutions to x2-px+q=0 are the same as the solutions to $x^2-\frac{p}{k}x+\frac{q}{k^2}=0$. It is easy enough to prove, but for the use of a nomograph like the approximations using the graph of 4y=x2, it allows you to work on a much narrower range of x and y values.
The article also referred to solutions of higher powers of trinomials that could be solved in the same way, but my little mind has not grasped it enough to explain it yet, so I save that for another day...
Tuesday, 28 July 2009
Saturday, 25 July 2009
testing
Just trying out a new method that allows latex on blogger, ignore for now...
\[\sum_{i=1}^{5}(x_i^2+1)\]
$\sum_{i=1}^n x_i\$
ADDED DETAIL
John D. Cook, who writes a really great blog over at The Endeavour pointed out that the Latex method I use does not show up on the Google reader screen as math, but Latex script. He also sent me a link to the "TeXer" at the Art of Problem solving in one of his comments (below) that is also a nice way to clip a picture and put it into your web page.
You go to the site and type in the code and press submit, then right click to save the picture and post to Blogger in the usual way (Not as quick, but I think it will show up in reader)..

John also pointed out that you can do a lot of math-typing with straight html, and sent this link as well from his web page (thanks John).
I do NOT know LaTex well, and I know many other HS teachers do not either, but I want to learn more without taking a concentrated course.... one way to learn, and compose LaTex script is to use a widget I have on my Google home screen called "Sitmo"

You can use the character and symbol screens to construct the symbol, then copy the LaTex code, or copy the image.. and of course, its also free.
A footnote for those keeping score: I just realized this was my 250th post on Blogger....

Monday, 20 July 2009
A Mandelbrot-like Set for Quadratics
The Mandelbrot set can be thought of as a catalog of closed Julia Sets over the complex plain. Each point on the plain representing a complex number, and the coloring representing whether the Julia set for that point had a closed or open orbit.
The equation y= 1/4 x2 on the coordinate plain can, in similar fashion, serve as a catalog of all possible quadratic equations. The method was discovered by a high school age British student by the name of Anthony Bayes around 1955 as reported in the Mathematical Gazette in September of that year by H. Gebert, the young man's teacher.
If every point (b,c) on the coordinate plain is representative of a quadratic equation x2+bx+c=0, then the set of all points in the cup of the parabola have only complex solutions [for example, the point (2,5) would represent the equation x2+2x+5=0 which has only complex roots]. Those points beneath the curve have two real distinct solutions, and the points on the curve specify equations which have a double root[ again, (2,1) would represent the perfect square trinomial x2+2x+1=0]. For any point on the curve, the solutions are -1/2 the x-coordinate. In the case of (2,1) the double root of x2+2x+1=0 is at -1/2 of 2 = -1.
Any line tangent to the curve passes only through points representing equations which share at least one solution. The line y=x-1 which is tangent to the curve at the point (2,1). Since the solutions for x2+2x+1=0 are both -1; all the points on this tangent represent quadratic equations which have x=-1 as one solution. As a case in point, (or a point in this case), (5,4) is on the tangent line, and the solutions of the quadratic equation x2+5x+4=0 are x=-1 and x=-4. If you drew the other tangent to the parabola passing through the point (5,4) it would contain the point (8,16) on the parabola representing the quadratic with a double root at x=-4, that is, the quadratic x2+8x+16=0.
The reflection of this tangent in the y-axis gives the tangent through the point representing the equation x^2-2x+1, with the double root at x=+1. At this point your students should know the point of intersection of the tangent at (8,16) and the tangent at (-2,1).
The equation y= 1/4 x2 on the coordinate plain can, in similar fashion, serve as a catalog of all possible quadratic equations. The method was discovered by a high school age British student by the name of Anthony Bayes around 1955 as reported in the Mathematical Gazette in September of that year by H. Gebert, the young man's teacher.
If every point (b,c) on the coordinate plain is representative of a quadratic equation x2+bx+c=0, then the set of all points in the cup of the parabola have only complex solutions [for example, the point (2,5) would represent the equation x2+2x+5=0 which has only complex roots]. Those points beneath the curve have two real distinct solutions, and the points on the curve specify equations which have a double root[ again, (2,1) would represent the perfect square trinomial x2+2x+1=0]. For any point on the curve, the solutions are -1/2 the x-coordinate. In the case of (2,1) the double root of x2+2x+1=0 is at -1/2 of 2 = -1.

Any line tangent to the curve passes only through points representing equations which share at least one solution. The line y=x-1 which is tangent to the curve at the point (2,1). Since the solutions for x2+2x+1=0 are both -1; all the points on this tangent represent quadratic equations which have x=-1 as one solution. As a case in point, (or a point in this case), (5,4) is on the tangent line, and the solutions of the quadratic equation x2+5x+4=0 are x=-1 and x=-4. If you drew the other tangent to the parabola passing through the point (5,4) it would contain the point (8,16) on the parabola representing the quadratic with a double root at x=-4, that is, the quadratic x2+8x+16=0.
 |
| Desmos |
The reflection of this tangent in the y-axis gives the tangent through the point representing the equation x^2-2x+1, with the double root at x=+1. At this point your students should know the point of intersection of the tangent at (8,16) and the tangent at (-2,1).
This would also allow a simple approximation method to find the solutions of any quadratic with reasonably small values using only a straightedge and a printed graph of the curve y=1/4 x2. Simply pick the point (b,c) corresponding to the values of the equation, and then lay a straight edge through the point and tangent to the parabola. The solutions would be -1/2 the x values of the points of tangentcy, as given above.
Saturday, 18 July 2009
"It could easily be shown..." Probability and Pi and the Riemann Zeta Function
Beware of articles that begin, "It could easily be shown..." It is like arm wrestling a two year old, if you win, so what, and if you LOSE??? Yow....
I know this, and yet, I still proceed foolishly to read them. The one currently on my mind was a "Note on Pi" by R. Chartes in the March 1904 Philosophical Magazine, my current old document of choice. It pointed out that ICEBS "that if two numbers are written down at random, the probability that they will be prime to each other is 6/pi2."
Here it is from Wolfram Mathworld:

This is the reciprocal of the famous answer to the Basel problem evaluate by Euler.
The fact that the probability that two random numbers are relatively prime was equal to this value was discovered by M. Cesaro and J. J. Sylvester in the same year, 1883. Sylvester gives a proof in a footnote to a paper I found in his collected works (page 602)
The original image from Sylvester seems to have dissappeared into the abyss since 2009, so I share a proof I found on the Physics Harvard edu websight,

Ok, yeah, that is sort of easy, and I should have figured it out...The proof is easy to extend to the probability that three numbers are relatively prime is the reciprocal of the sum of the reciprocal of the cubes (if that seems hard to read, try to write it). More simply, the probability is the reciprocal of ζ(3)=
Let a,b and c be integers chosen at random
The probability that a, b, and c have no common divisor:
where denotes the zeta function:
the decimal value is approximately
Strangely, the discovery (by Sylvester) is nested in work he was doing with Farey Fractions.
If you haven't been exposed to Farey Fractions, a quick share from Wolfram's Mathworld
The Farey sequence  for any positive integer
  is the set of irreducible rational numbers
  with
with  and
and  arranged in increasing order. The first few are
 |  |  | (1) |
 |  |  | (2) |
 |  |  | (3) |
 |  |  | (4) |
 |  |  | (5) |
(OEIS A006842 and A006843). Except for  , each
  has an odd number of terms and the middle term is always 1/2.
------------------------------------------------------------------
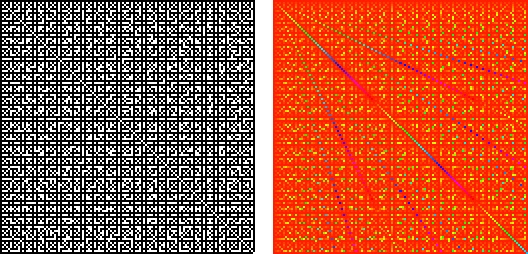
The image at the top shows a pair of coordinate axes with a point (x,y) painter black if GCF(m,n)=1, and white otherwise. I think one of the really nice things that can be done with younger students studying common factors and slope (can I say in Alg I?) is to show them that the greatest common factor of m and n is the number of lattice points on the line from (0,0) to (m,n)....[not counting (0,0)] Here is a graph of the segments to (4,10) and (12,3)

Subscribe to:
Posts (Atom)