I wrote awhile back about the probability of an event that had never happened, and the use of the "Rule of three. "
By that method, the 95% confidence interval for the probability of a lowest seed winning ranges from zero up to 3/108, or (0, 2.78%)... There is hope yet...
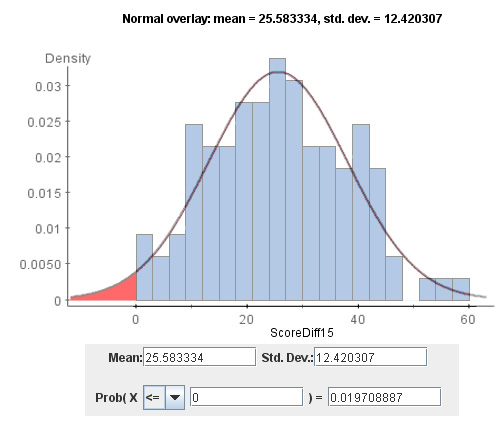
Just today I found a really nice graphic on Statpics by Robert W. Jernigan, whom I have suggested to you all before. He produced the chart below showing the point spread for each of the 108 games over the years, and found they were almost normally distributed. With the mean and standard deviation of the difference in scores shown below. He used the fitted normal curve to produce the probability of the low seed winning and came up with 1.97%... So both methods should provide hope for fans of the low seeds... Next year guys... next year..
1 comment:
Thanks for spreading the Statpics word!
Post a Comment